This metric shows how many times per month, on average, people in a given country search for your target keyword.
In Google Keyword Planner (which is the primary source of this data), they call it “Avg. monthly searches:”
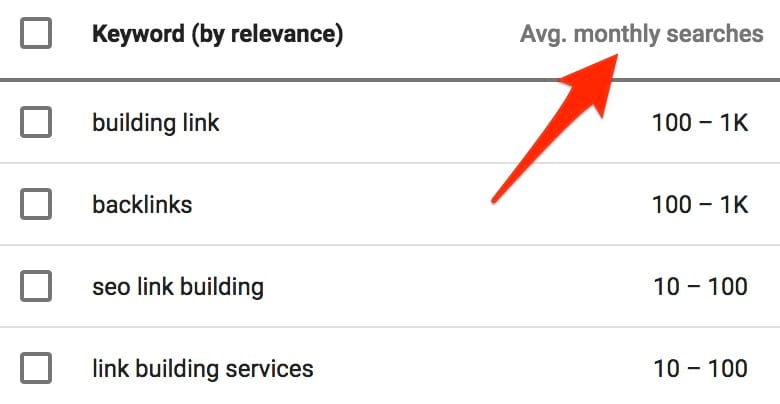
In many SEO tools, the term “Search volume” will often be shortened to just “Volume.”
The first thing you need to understand about search volume is that it refers to the number of “searches” and not the number of “people.” I mean, you and I could each perform a hundred searches for “bitcoin price,” which would result in a total search volume of 200 searches generated by only two people.
Here’s another crucial, yet often overlooked part of the definition: “on average.”
You see, for many search queries, the “search demand” isn’t consistent throughout the year.
Take the keyword, “Christmas gifts,” for example, which sees a HUGE spike in search demand every December before dropping off in January.
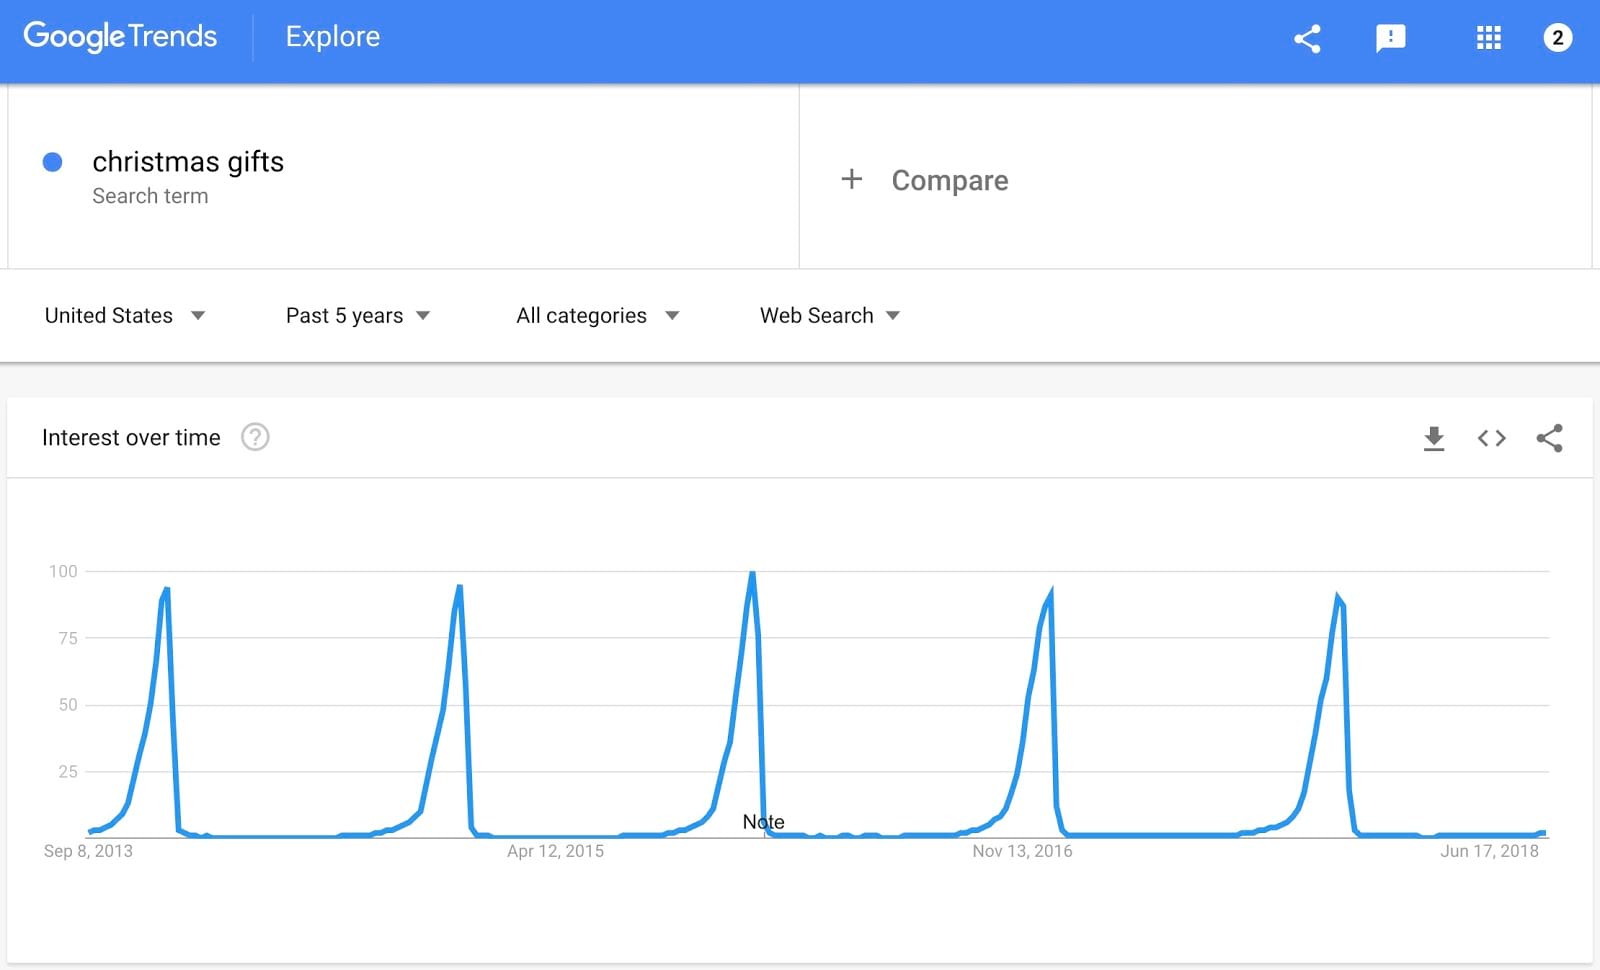
What number of monthly searches do you expect to see for the keyword “Christmas gifts?”
The number of searches for December or June?
Well, what you get from most SEO tools is the average number of monthly searches for the past 12–24 months. In the case of “Christmas gifts,” that only serves to mislead people about the real search demand of this topic.
The number of months that form the average will depend on the tool you’re using.
Please also pay attention to the fact that search volumes are ALWAYS location-specific.
Most keyword research tools default to showing search volumes for the United States. However, you may wish to know how many searches are performed in the UK, Australia, Canada, or some other country. Or perhaps you want to know the global search volume? (the sum of searches across all countries)
Here’s where you find this data in Keywords Explorer:
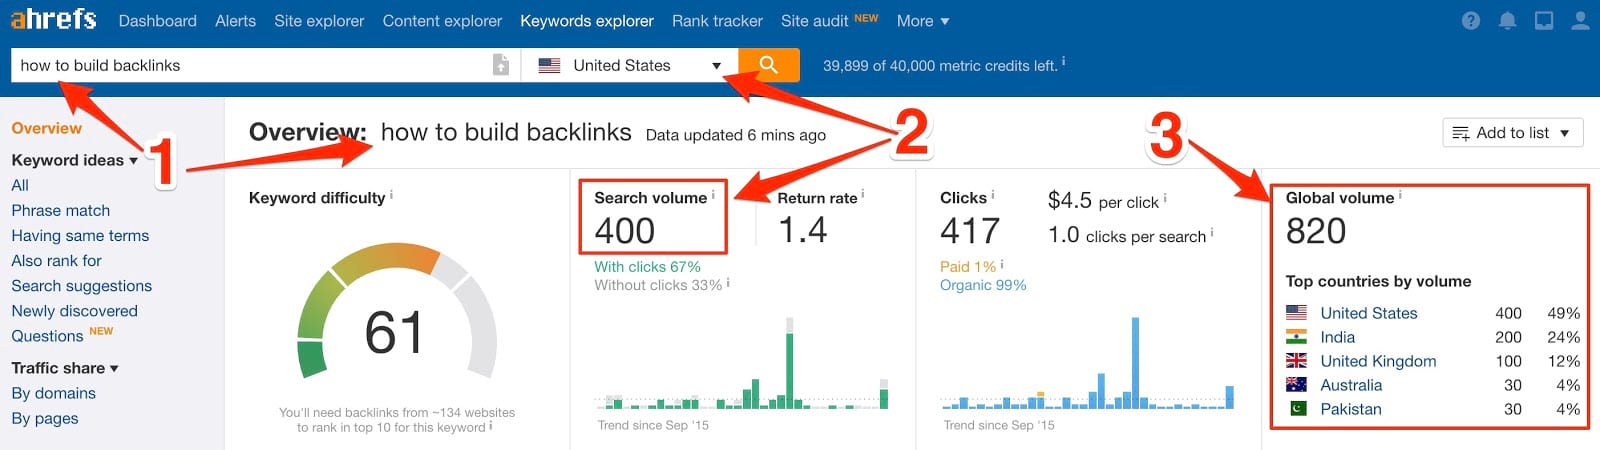
- The keyword that you’re analyzing;
- The country that you’re requesting data for, and the search volume in that country;
- Global search volume, and a breakdown of top countries by search volume.
Do you want to dig deeper into this metric?
Let’s do a brief Q&A:
Q1: “How accurate are the search volumes in Google Keyword Planner?”
A1: “We don’t have any evidence to suggest that the search volumes you see in Google Keyword Planner are 100% accurate.
As we discussed earlier, search volume is calculated as an average from the past 12 months. There’s no way to know how many searches a particular keyword will get in the next 30 days or the month after that.”
Q2: “Why do search volumes in keyword reports/research differ from those in Google Keyword Planner? Is this a bug?”
A2: “No, that is by design.
We only use the search volumes from Google Keyword Planner as our initial data source. We then add clickstream data into the mix to calculate our own refined monthly search volumes.”
Q3: “Is monthly search volume a good predictor of the search traffic that I might get to my page should I rank at the top of Google?”
A3: “In general, yes. But there are quite a few ‘it depends’ that you should be aware of.”
Return Rate (RR) shows how often the same person searches for a given keyword over a 30-day period.
RR1 means that people typically don’t search for that keyword again within 30 days.
But RR2 and RR3 don’t mean that people search for a given keyword two and three times per month respectively. It just means that the second keyword tends to get more repeated searches than the first one.
Let me illustrate with a few vivid examples:
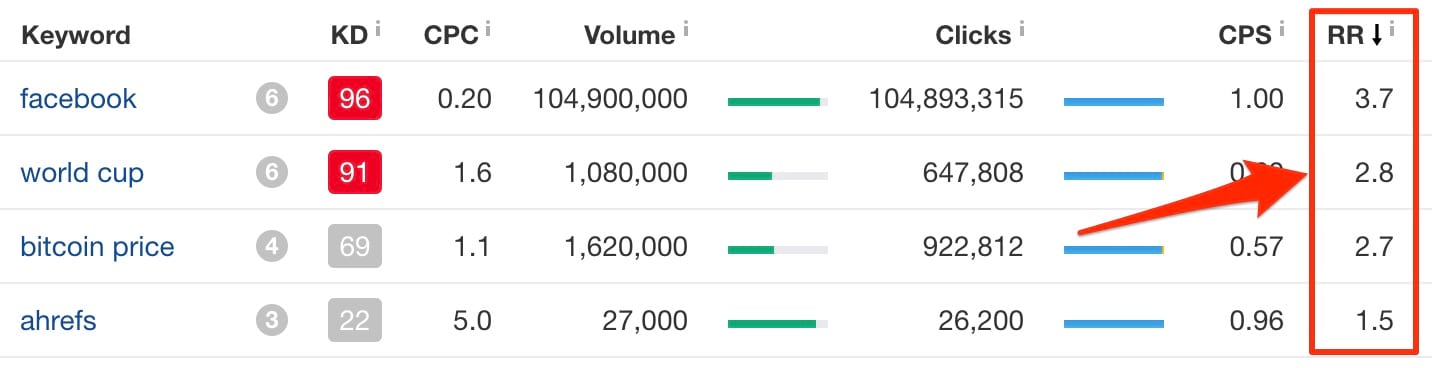
The keywords “world cup” and “bitcoin price” have Return Rate (RR) of 2.8 and 2.7 respectively, which means that people are doing roughly the same amount of repeated searches for these keywords.
But both searches are lagging behind the keyword “Facebook,” which has a super high Return Rate (RR) of 3.7. This is probably because a lot of people search for “Facebook” in Google, rather than typing the URL directly into the search bar.
I’m sure you’ve noticed Google’s recent experiments with “quick answers” and other various SERP features. These are designed to prevent the need for users to click through to any of the search results… and it’s working.
As a result, the gap between the number of searches performed and the number of clicks on the search results is widening.
Here’s my favorite example:
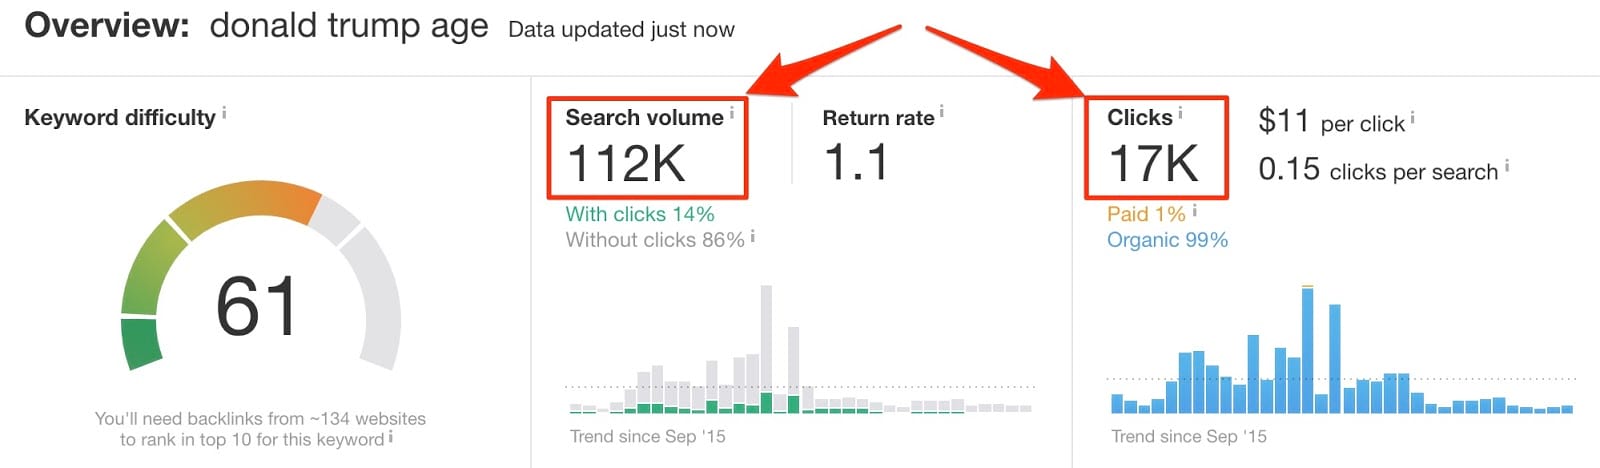
You can see that folks in the US are searching “donald trump age” over 112,000 times per month. But they only make 17,000 clicks on the search results.
If you open Google and search for “Donald trump age,” you’ll see why the vast majority of searches don’t result in any clicks on the search results: the answer is right there.

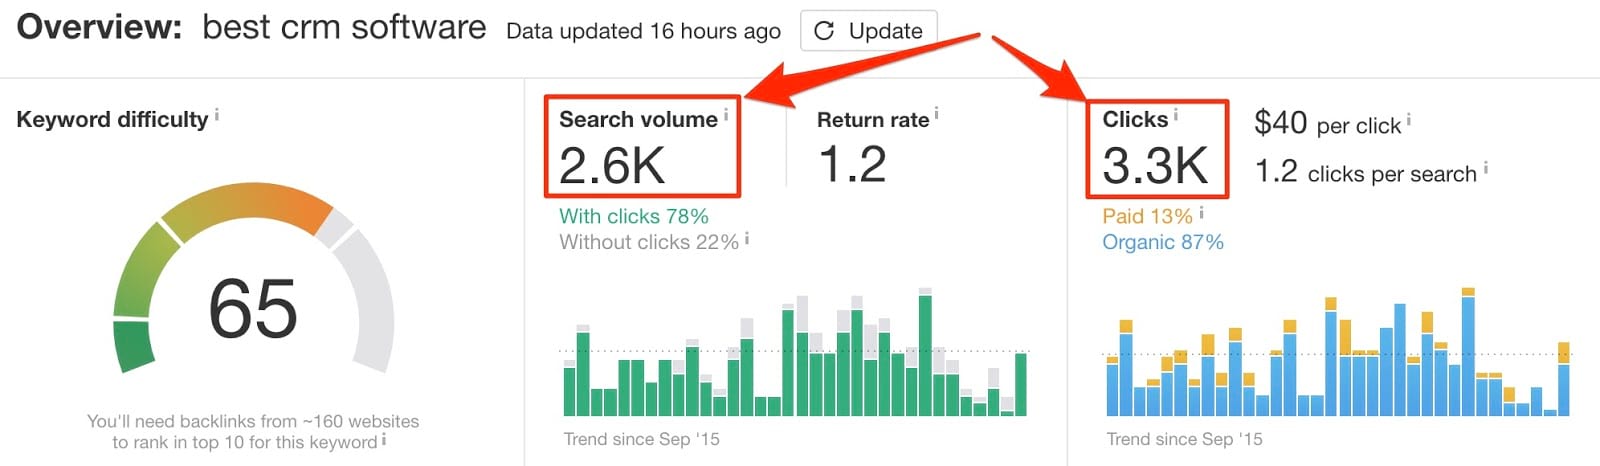
On the contrary, when you search for “best CRM software,” you’re likely to click on a few search results to make sure you source opinions from different websites. The result: a higher number of clicks than the actual number of searches.
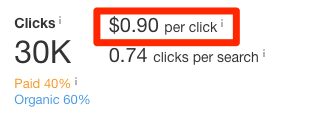
For the sake of convenience, we also display CPS (Clicks Per Search). This refers to the average number of clicks that people perform after searching for a given keyword.
Did you also notice the organic and paid percentages underneath the number of clicks?
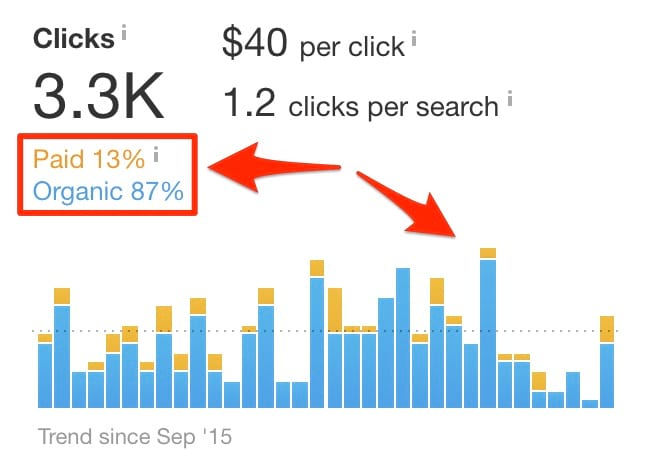
Two years ago, Google started showing four ads above the organic search results.
These paid results can often “steal” a fair number of clicks that would otherwise go to the organic search results.
Because Ahrefs (our primary SEO tool) processes a large amount of clickstream data, we’re able to calculate the approximate distribution of clicks between the paid and organic results.
Thus, for the keyword “best CRM software,” you can see that only 13% of clicks go to paid results. Most likely, this is because people prefer to get this kind of information from sites that rank organically, rather than those that pay to be featured.
Now let’s look at a branded search query like “Sennheiser headphones”:
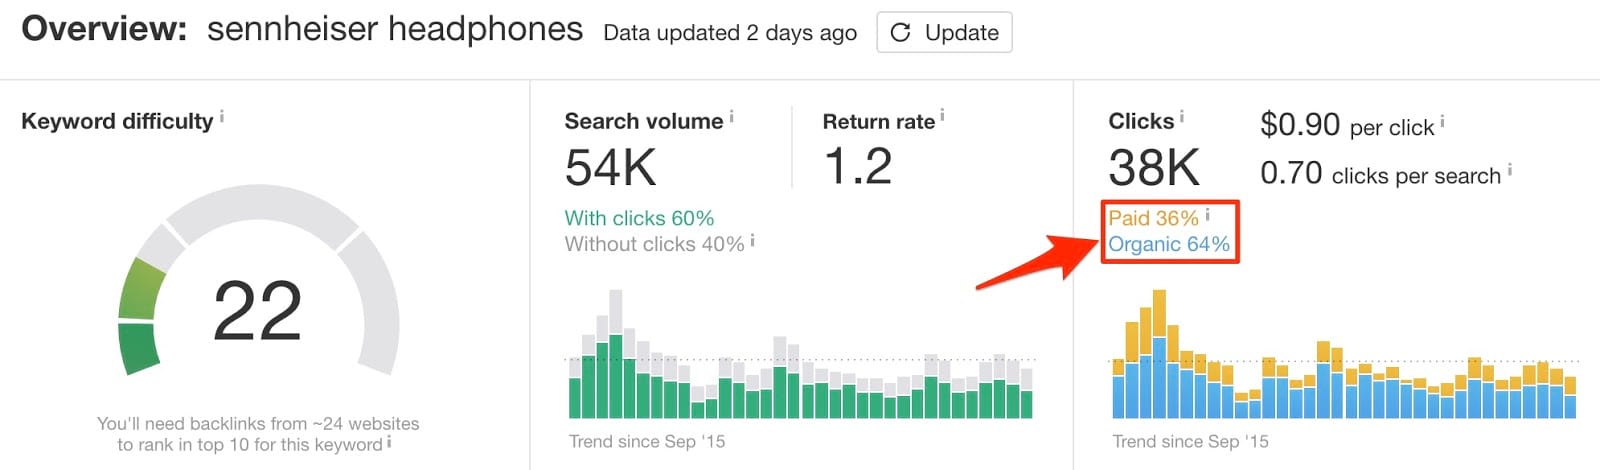
This time a whopping 36% of all clicks go to the paid ads.
That is most likely happening because Sennheiser is bidding on their brand name, and consumers don’t mind clicking on the ad from a brand they’re searching for.

CPC shows the average cost of a click on a paid search result for a given keyword.
Cost Per Click (CPC) is a dynamic and highly-volatile number that can change on the fly as advertisers increase or decrease their ad spend. That is why we always recommend that you use Google AdWords if you’re looking for the most recent and accurate CPC values for your list of target keywords. That’s where our data originates.
As for the CPC values that you see in our keyword reports/research—they are just averages. We display them for reference purposes only, so please take them with a pinch of salt.
Keyword Difficulty (KD) is a metric that, according to my observations, causes a lot of confusion in our industry. So let’s explain it in detail.
We calculate the KD score by taking a weighted average of the number of linking domains to the current top-10 ranking pages and then plotting the result on a logarithmic scale from 0 to 100.
It doesn’t take into account any other variables whatsoever.
The resulting number, therefore, provides a reasonable estimation as to how many referring domains are needed to rank somewhere in the top 10 for your chosen keyword.
You’ll see this written in plain English directly underneath the KD score in Keywords Explorer.
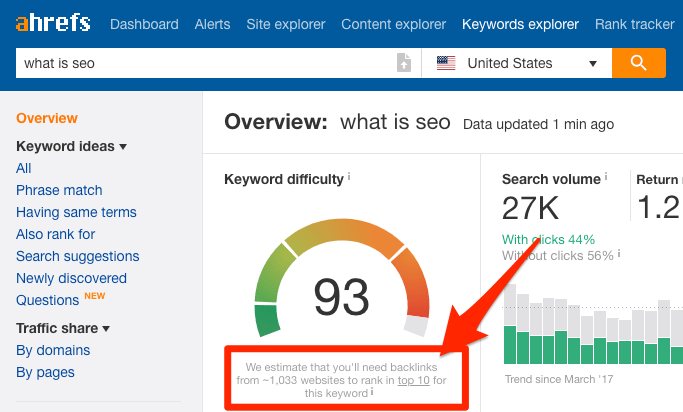
Did you notice how it says “top 10” and not the top 3 or even #1?
That’s because, according to our observations, backlinks are what effectively get you into top10. From thereon, many other ranking factors are likely to kick in (like user behavior or dwell time).
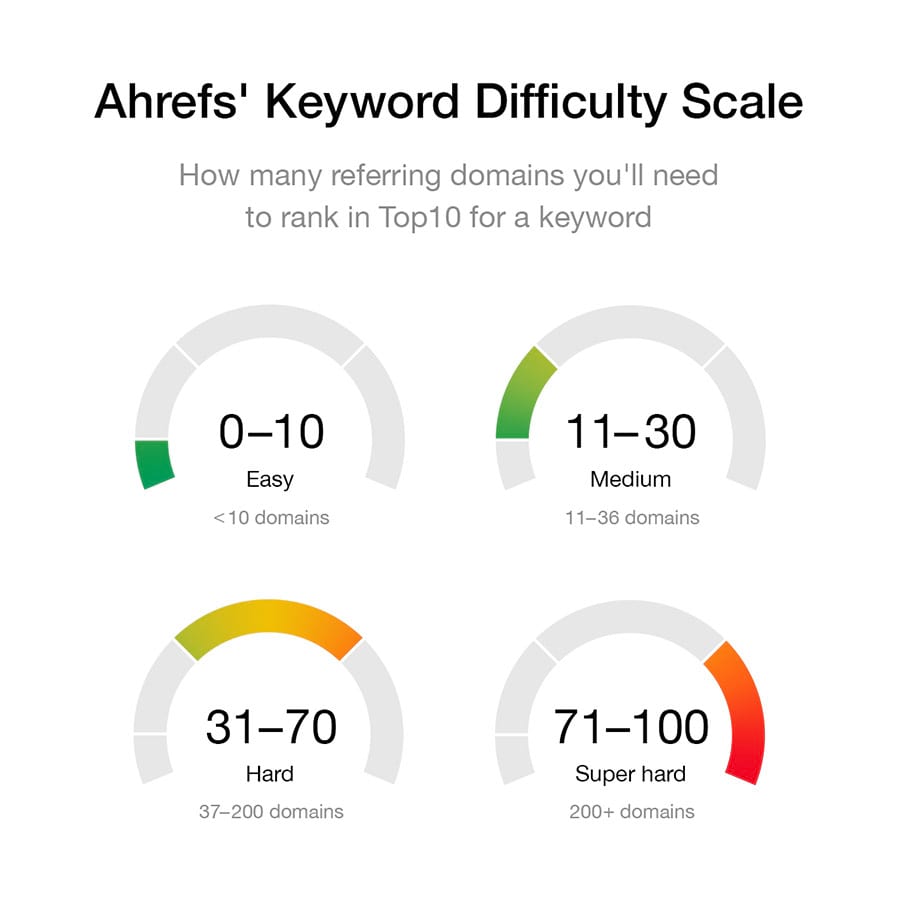
Please also note that our KD scale is non-linear. So KD 50 is not a “medium” keyword difficulty, it’s a “hard” one:
Now, I see a lot of people talking about the accuracy of KD.
But here’s the thing: Keyword Difficulty (KD) takes into account only one variable: backlinks.
We know that the number of backlinks (ref. Domains) correlates nicely with a page’s ability to rank. Google has even confirmed that backlinks are one of their top 3 ranking factors.
But backlinks are far from the only ‘ranking factor.’ Google cares about hundreds of things when choosing what pages to rank, like:
- How “strong” is your website? — Established sites often rank easily even for the most competitive keywords, while brand new sites find it challenging to rank even for non-competitive ones.
- How “good” is your page? — Same here, it’s unlikely that a lackluster page will outrank a beautiful and detailed authoritative page.
Keyword Difficulty (KD) doesn’t know the answer to either of these questions. It can only base its estimates on a single variable—backlinks.
So what’s the point of KD then?
Let’s simplify with an analogy:
Taller basketball players are more likely to be great players than short ones.
So does that mean that if you’re 5’3”, then it’ll be impossible to beat a 6ft player?
Not at all. Despite height being a BIG contributing factor to success, it’s not the ONLY contributing factor. I mean, perhaps you have some other advantageous physical attribute that increases your ability to win despite your short stature—e.g., bionic legs.
Where am I going with this?
Keyword Difficulty (KD) effectively tells you the average height (backlink profile strength) of the other players in the game (top-ranking pages). The higher the number, the more height (backlinks) you’ll likely to need to stand a chance of ranking.
However, if you have the metaphorical SEO equivalent of bionic legs (e.g., insanely great content that perfectly matches search intent), you might be able to ‘win’ despite having a shorter stature (weaker backlink profile) than the rest of the players.
Bottom line: Keyword Difficulty (KD) is useful for estimating how difficult it may be to rank, but keep in mind that it doesn’t tell the full story because it’s based on only one ‘ranking factor’—backlinks.
Take it with a pinch of salt and ALWAYS investigate the SERPs further before pursuing a keyword.
Now let me address some of the most popular questions about Keyword Difficulty:
Q1: “How accurate is Ahrefs’ KD? Is it more or less accurate than the keyword difficulty score in other tools?”
A1: “By definition, our KD score is neither accurate nor inaccurate. It doesn’t estimate your chance of ranking for a given keyword. Reason being, it doesn’t know anything about the quality of your website or SEO skills. It merely tells you the average strength of top-10 ranking pages’ backlink profiles.
Furthermore, it makes no sense to compare Ahrefs’ KD score to similar metrics in other tools because they probably don’t calculate their scores in the same way.”
Q2: “Do you take on-page factors into account when calculating KD?”
A2: “No. Ahrefs’ Keyword Difficulty (KD) is based solely on the number of referring domains linking to the top-ranking pages for your target keyword. Even if you were to feed our algorithm some data about the page that you’re trying to rank, we still wouldn’t know how to accurately “weight” those on-page factors and give you an accurate ranking prediction.”
Q3: “The #1 result is very strong! How come the KD score is so low?”
A3: “Ahrefs’ KD score is based on a weighted average of referring domains pointing to the top 10 ranking pages. That’s why it gives you a prediction of how many referring domains you’ll need to get to rank in the top 10 results, which has nothing to do with outranking the #1 result for your target keyword.”
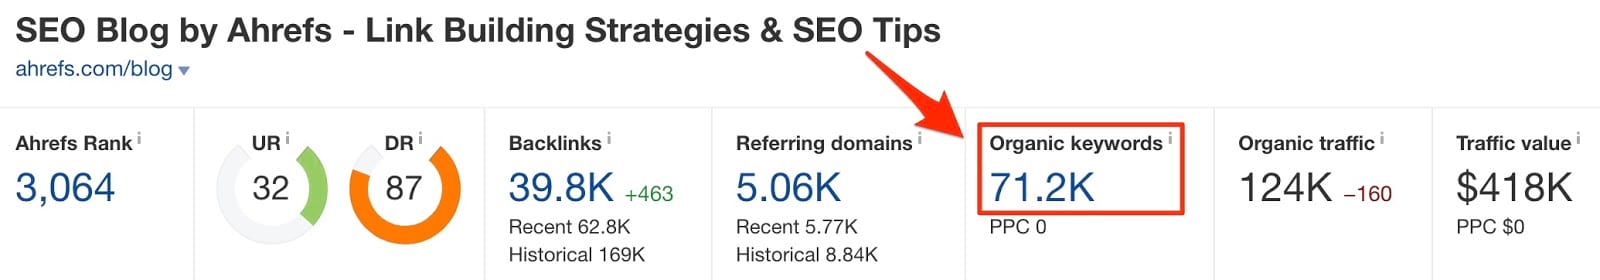
In our keyword reports/research, and you’ll often see the total number of keywords for which a page ranks in the organic search results:
How is this number derived?
We check to see if your website ranks in the top 100 search results for any of the ~605 Million keywords in our database.
605M is a HUGE number of keywords for us to monitor, but it’s still much fewer than the actual number of unique search queries that people enter into Google… especially if you consider the fact that 16–20% of daily Google searches have never been seen before.
That’s why the number of organic keywords that you see in our keyword reports/research will almost always be smaller than the actual number of keywords for which your target ranks.
Please also note that we update our keyword database with newly-discovered search queries on a monthly basis. We also regularly purge search queries from our database if their popularity fades to zero.
This means that the number of organic keywords we report for your website might increase simply because our database grew, and not because your website started ranking for more search queries.
But this means that the organic keywords graph should show “jumps” every month as our database grows, right?
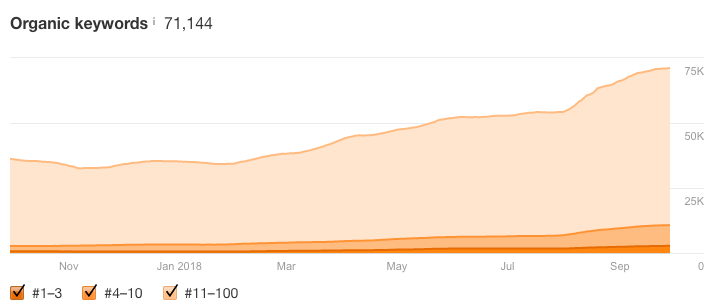
Not really.
Each time we enlarge the database, we rebuild the organic keywords graph to smooth out the trend. As a result, you won’t see any confusing monthly “jumps.”
One final thing to note about our organic keywords metric is that it’s almost always country-specific.
Take a look at the Top pages report, for example:
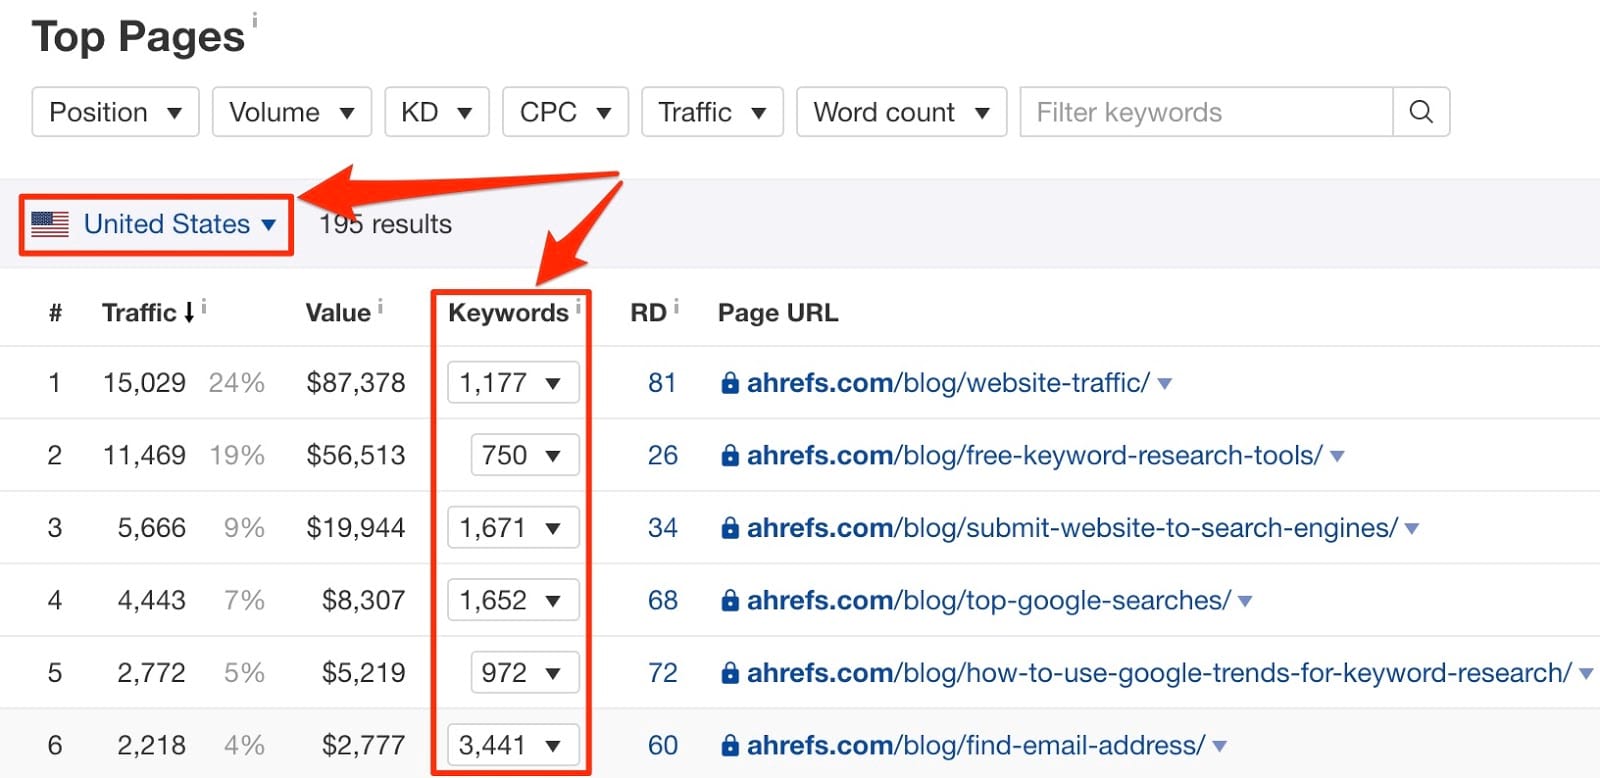
The number of keywords shown here is for the United States only.
If you want to see this data for all countries, choose the appropriate setting in the drop-down.
This metric estimates how much organic search traffic the target website, subsection or web page gets each month.
How is it calculated?
- We find all the keywords for which the target ranks.
- We estimate how much traffic the target gets from each of those keywords. (this is based on the sites ranking position and our estimated CTR for that position.)
- We add up all these numbers.
Now, customers often ask us why the estimated organic search traffic for their website in our keyword reports/research/Ahrefs doesn’t match the number that they see in Google Analytics.
This is a good question, and the answer is simple: it’s impossible for all the variables in our traffic estimation formula to be 100% accurate.
Let me explain why this is the case for each variable.
Monthly search volume: As discussed above, this metric is a 30-month rounded average. Search volume is a fundamentally inaccurate metric.
Position in the search results: Even if we forget about things like personalization and location, the position of a page in Google’s search results can change at any minute. You might rank #5 in the morning and drop to #8 by noon. Only the most popular keywords in Ahrefs’ database are updated hourly. Less popular ones are updated daily, and the least popular ones may only be updated once a month.
CTR: To the best of my knowledge, Ahrefs is the only tool on the market to create a unique CTR curve for almost every keyword.
Example:
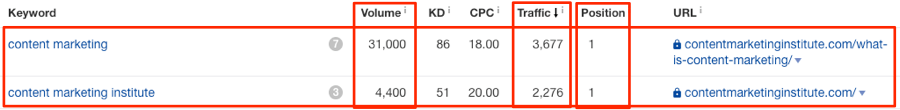
Content Marketing Institute ranks #1 for “content marketing” and “content marketing institute.”
Both of these queries have VERY different search volumes. “Content marketing” gets 31,000 searches per month, whereas “content marketing institute” gets only 4,400—that’s roughly 85% less!
But you can see above that they get roughly the same amount of traffic from each query.
That’s because their click-through rate for “content marketing” is around 12%, whereas they get a whopping 52% click-through rate for “content marketing institute.” This makes sense, because the latter is a branded query, so people are more inclined to favor pages from contentmarketinginstitute.com over those from other sites in the search results.
How do we know this? Because of the unique CTR curve that we build for each of these keywords.
There are some keywords (mainly low-volume ones) for which we don’t build a unique CTR curve due to a lack of data.
But using a clickstream-based CTR prediction isn’t 100% accurate, and adds yet another layer of discrepancy to our total organic traffic estimation.
And finally, one last variable:
The number of keywords: This is something that I already explained in the “organic keywords” section above. Our keyword database is HUGE, but there’s no possible way to know about all the search queries that people search for in Google.
That said, you should treat the organic traffic estimations in our keyword reports/research as precisely that—estimations.
They will always differ somewhat from the real numbers that you see in Google Analytics.
Oh… one final point:
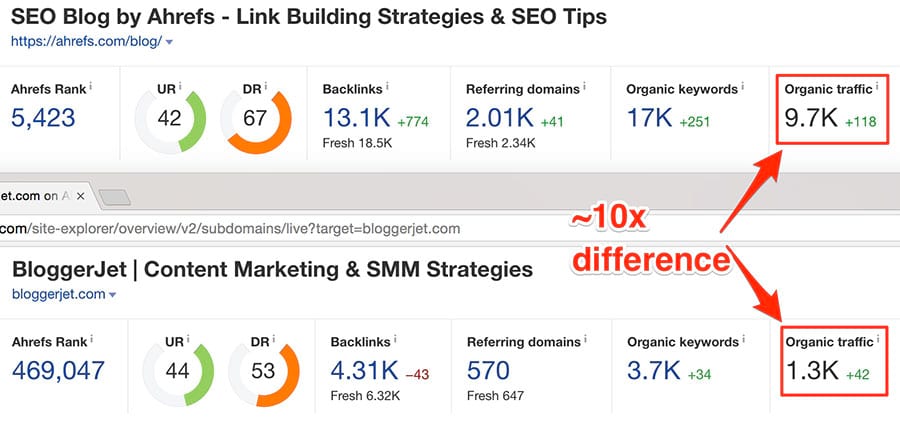
Even though our organic traffic metric cannot possibly show precisely how much organic traffic a site gets, it works INCREDIBLY well for comparing traffic to sites in the same niche.
Here, Ahrefs shows that my personal blog gets around 10x less search traffic than this very blog:
Which is exactly the case, if you look at the numbers from Google Analytics:
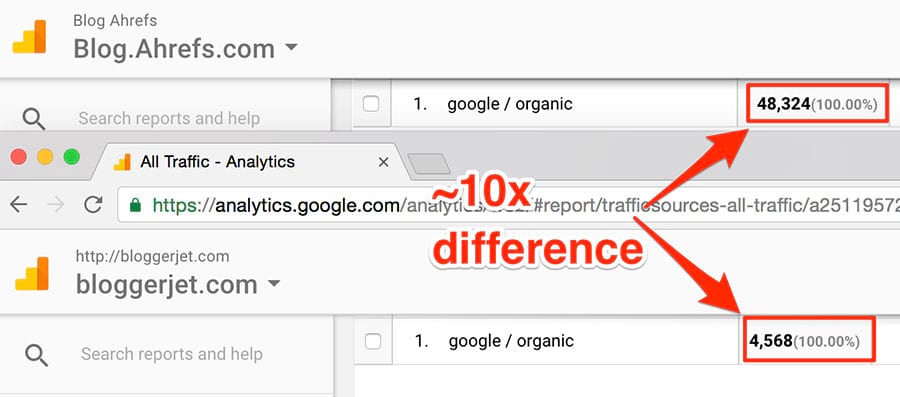
These screenshots were taken in early 2017 when I published the first version of this article. Today Ahrefs blog gets much more search traffic than that 🙂
In other words, if you’re looking to learn how much more (or less) organic search traffic your competitors get compared to your website, our keyword reports/research/Ahrefs should do the job perfectly.
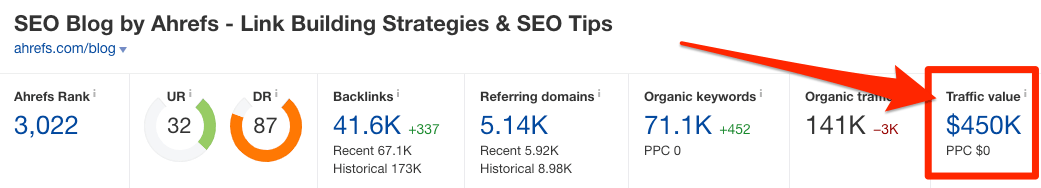
This metric shows the value of a website’s organic traffic, should that traffic have been bought via Google AdWords.
Confused? Let me explain:
Here’s one of the keywords for which the Ahrefs blog ranks: “SEO tips”:
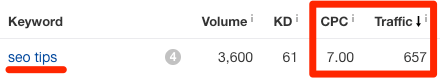
You can see that we get an estimated 657 visits per month from this keyword from organic search, and it has a CPC (Cost-Per-Click) of $7.
So if we were to buy 657 visits by bidding on this keyword in Google AdWords, it would cost us $4,599 ($7 * 657)
But that’s just for one keyword, in one country (US).
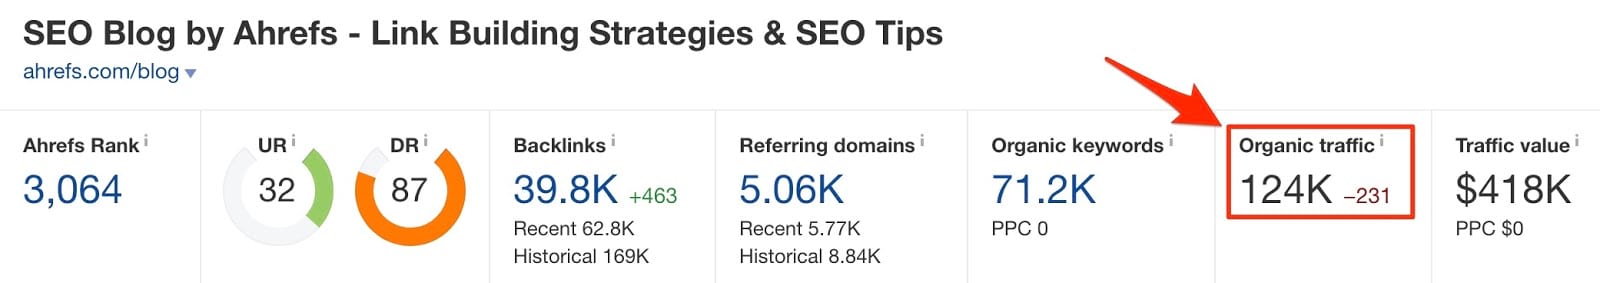
What if we were to do this calculation for all the 71,000+ keywords for which the Ahrefs blog ranks across 170 countries, then add all the numbers together?
Answer: We’d get the Traffic Value.
You can see this here:
Now, as with our organic traffic metrics, this is ONLY an estimation.
If you were to bid on this keyword in Google AdWords for real, it probably wouldn’t cost you exactly $7 for every click.
That’s because Google AdWords is an auction—advertisers change their bids all the time (or start/stop their ads) and, as such, prices are highly volatile and have a tendency to fluctuate.
For that reason, we have to use the average CPC to calculate this metric.
So like I said, Traffic Value is an estimation and you should use it for reference and comparison purposes only.
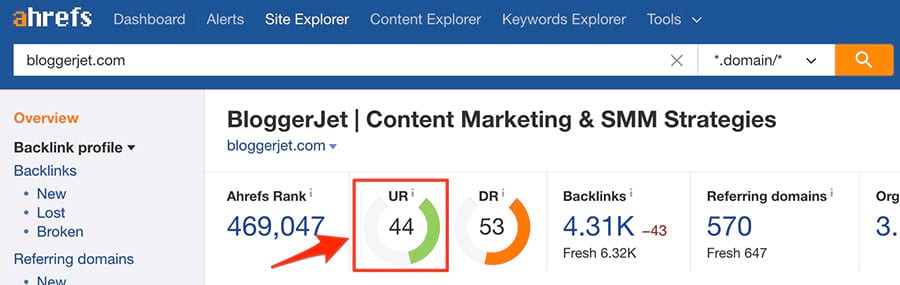
URL Rating (UR) shows the strength of a target page’s backlink profile on a logarithmic scale from 0 to 100, with latter being the strongest. Both internal and external links are taken into account when calculating this metric (but they’re “weighted” differently).
“Logarithmic” means that it’s much easier to grow your page from UR 20 to UR 30 than from UR 70 to UR 80.
URL Rating (UR) has a clear positive correlation with Google rankings, meaning that high UR pages tend to rank higher in organic search results.
If you’re familiar with Google’s PageRank formula, then it should be easy for you to understand our keyword reports/research/Ahrefs’ URL Rating (UR). That’s because we use all the same basic PageRank principles to calculate URL Rating (UR).
- We count links between pages;
- We respect the “nofollow” attribute;
- We have a “damping factor”;
- We crawl the web far and wide (which is a critical component when calculating an accurate link‐based metric)
Translation: URL Rating (UR) is a near-perfect way to gauge the “link popularity” of a page, which is likely the reason it correlates so well with Google rankings.
That said, please don’t think of URL Rating as a direct PageRank replacement. Google’s PageRank formula has evolved a lot since its inception, whereas the calculation for Ahrefs’ UR remains simplistic in comparison. If we were to make this formula more complex, it would become too costly to frequently update for the BILLIONS of pages in our index—a cost that would have to be passed on to the customer.
IMPORTANT: I see a lot of people say things like “The UR & DR of this domain are…” It is wrong to say that. UR is a page-level metric, whereas DR is a domain-level metric. When you put a website into Ahrefs’ Site Explorer and see its URL Rating, that’s the UR the homepage only.
Domain Rating (DR) shows the strength of a target website’s backlink profile on a logarithmic scale from 0 to 100, with latter being the strongest.
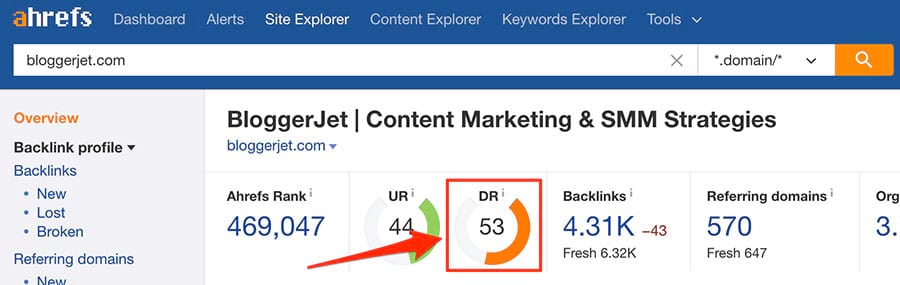
Google has repeatedly denied using any domain-wide link metrics in their ranking algorithm, so this metric is not based on any known math behind Google. However, it does work in a similar way to the original PageRank calculation (as long as you do the math between websites and not web pages.)
The purpose of Domain Rating (DR) is very straightforward—to assess the “relative link popularity” of a given website.
For that reason, it is a super-useful metric to look at when link prospecting, as links from sites with high “link popularity” are typically more valuable than those from sites with a low “link popularity.”
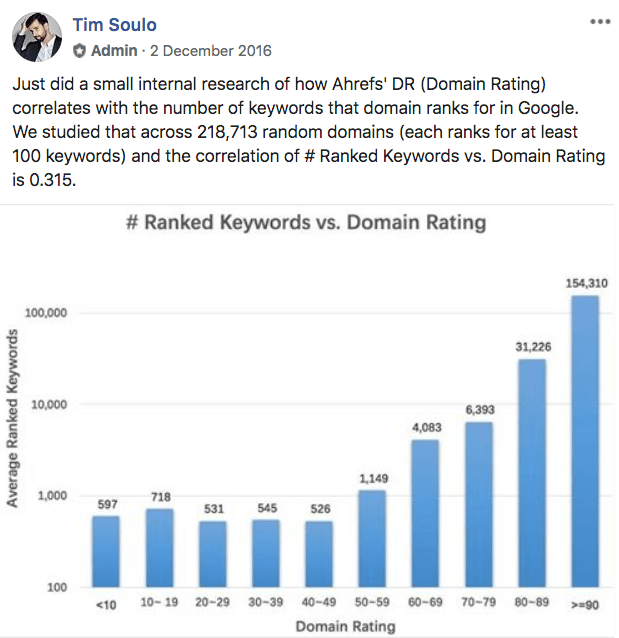
“Link popularity” (Domain Rating) is also a useful metric by which to estimate a website’s ability to get search traffic from Google.
How do we know? We studied the correlation between Domain Rating (DR) and organic search traffic for 200K+ domains and saw that the two correlate well.
 Let’s also do a brief Q&A here to answer some of the most popular concerns:
Q1: “The top 10 ranking pages for my target keyword belong to very high-DR websites. Do I have any chance of outranking them if the DR of my website is 30–50 points lower?”
A1: “You do have a chance of outranking them. Firstly, Google has confirmed they don’t have a domain-wide authority metric. Secondly, the experience of many thousands of SEO professionals says that you can outrank “big” sites if you build more quality backlinks to your page than they have.”
Q2: “How come my DR is much higher or lower than my UR?”
A2: “It is worth mentioning that even though both ratings are based on backlinks, they are calculated differently and cannot be directly compared. DR looks at the quality and quantity of domains linking to your entire website, whereas URL Rating (UR) looks at the quality and quantity of web pages linking to the individual page that you’re researching.”
Q3: “Should I only get links from high-DR sites? Can links from low-DR sites hurt me in any way?”
A3: “As a general rule, links from high-DR sites tend to bring more value than links from low-DR sites. That is largely because high-DR sites tend to have high-UR pages. But you may find high-UR pages on low-DR sites, too.
That said, links from low-DR sites will not hurt you in any way. Domain Rating (DR) is not indicative of a website’s spamminess, so links from low-DR sites should not be deemed “toxic.” If you need to identify bad links, you should get SEO help, because this is usually a red flag for worse things to come.
Q4: “I didn’t lose any of my backlinks. Why did my DR drop?”
A4: “That’s because other sites have gained a lot of backlinks. Think of it this way: when a DR100 website gets more backlinks, we can’t make it DR101. So instead we push all the other websites down by 1. That’s a very raw explanation of why you might see a drop in your DR while no backlinks were lost.”
Q5: “How come my DR is lower than that of my competitor even if I have more backlinks?”
A5: “Please note that for DR, we take into account both the quantity and quality of backlinks. Furthermore, we also look at how many other unique sites each linking domain links to. Should you have a link from a DR26 domain linking to five other domains, it will have a greater effect on your DR than a link from a DR73 domain which links to 5K domains.”
If you sort all the websites in the world by the strength of their backlink profiles, you get the Ahrefs Rank (AR).
![]()
![]()
Thus, Ahrefs Rank #1 belongs to the website with the strongest backlink profile (Facebook.com), #2 belongs to the second strongest (Twitter.com), #3 belongs to the third strongest (YouTube.com), and so on.
You can see the full list of domains sorted by their Ahrefs Rank here.
Here are a couple of common questions we get about Ahrefs Rank:
Q1: “My backlink profile is growing, but my Ahrefs Rank is going down. Why?”
A1: “Because other websites are getting new backlinks faster than you. What happens here is very similar to my above answer about a drop in your DR.”
Q2: “Why did my AR drop by a million? Am I in trouble?”
A2: “Ahrefs Rank is more volatile at the lower end of the scale. Think about it; there are only a handful of websites in the world with millions of backlinks (Twitter, Facebook, YouTube, etc.) It would take a lot of effort for those sites to outrank each other in terms of Ahrefs Rank.
But at the very bottom end of the scale, we have many websites with few to no backlinks. If one of those sites got one new backlink, that may be enough to push its Ahrefs Rank down by hundreds of thousands of points.
And if your Ahrefs Rank dropped despite not losing any backlinks, it simply means that a million sites grew their backlink profiles while yours remained the same.”
Link Indexes: Live, Recent & Historical
When browsing backlink reports in Ahrefs’ Site Explorer, you may notice a “Live / Recent / Historical” switch that changes some of the numbers in your report when toggled.
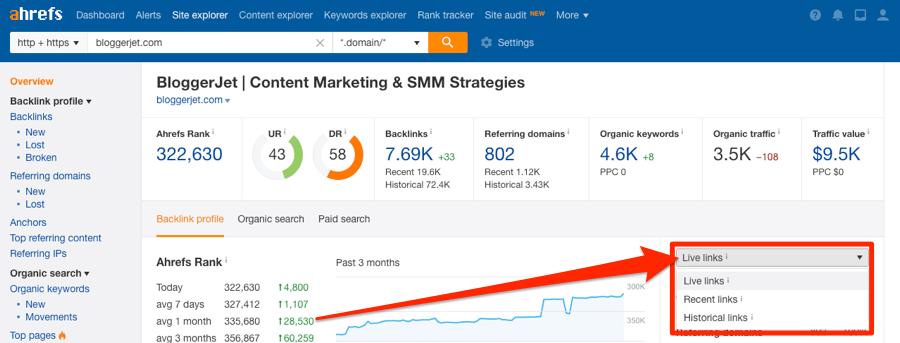
What is the difference between these link indexes?
As you may already know, we crawl the web 24/7, and we add newly-discovered backlinks to our backlink index every 15–30 minutes.
But not only do we crawl new pages, we also re-crawl old ones. When we do, we often discover that some of the links that were previously alive are, in fact, no longer live.
These links are instantly removed from our “Live” index but kept in our “Recent” index for a further 90 days. If they reappear during that period, they’ll be transferred back to the Live index.
You can more about “lost links” in this comprehensive ‘help’ article.
As for our “Historical” index, this contains all links that our bots have ever seen as “Live.”
How is that useful, you ask?
Well, thanks to the “Historical” index, I can see that Brian Dean of backlinko.com used to have a link from an article published at outbrain.com, but it got removed for some reason:

As that article is still live on their blog, Brian could investigate why they removed the link and, maybe, convince them to restore it.
But that’s not the only use case: You could also use the Historical index to investigate how a potential clients backlink profile has changed over time. More specifically, you can use it to find spammy links that were removed.
Why do reported SEO metrics sometimes differ across different tools in Ahrefs?
Let’s paste one of our blog posts into Ahrefs’ Site Explorer.
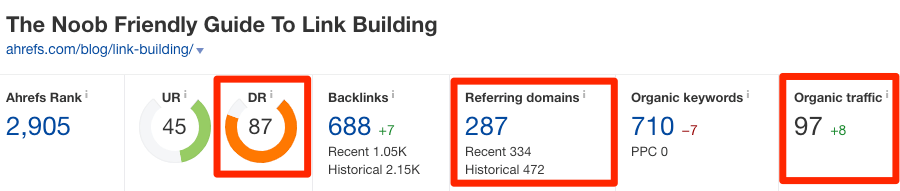
- Domain Rating (DR): 87
- Referring Domains: 287
- Organic Traffic: 97
Now let’s view that same blog post in Ahrefs’ Content Explorer.
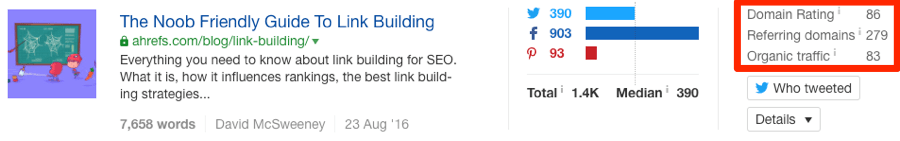
- Domain Rating (DR): 86
- Referring Domains: 279
- Organic Traffic: 83
The numbers are very similar but not the same. Why is this?
So the thing is, different tools in Ahrefs use different indexes (databases). We have two keyword indexes (for Keywords Explorer and Site Explorer), three link indexes (Live, Recent, Historical) and one content index (for Content Explorer).
If you search for something in Content Explorer, you search our content index.
If you look up a keyword in Keywords Explorer, you search our main keywords database.
If you analyze a web page in Site Explorer, you search our link index and “SERPs index” (which holds organic traffic data).
So to show metrics like referring domains and organic traffic in Content Explorer we have to make calls to our other databases. However, doing that makes the tool much slower. The workaround is to cache these numbers.
This is something we do in many of our reports.
For example, when you check the top 10 search results for a keyword with the SERP Overview in Keywords Explorer, the data you see comes from our “SERPs index.” However, this index doesn’t have link or traffic data, so we also have to call other databases to pull all the data we need into a single report.
But again, this is very slooooowwwwwwww, so we just cache it.
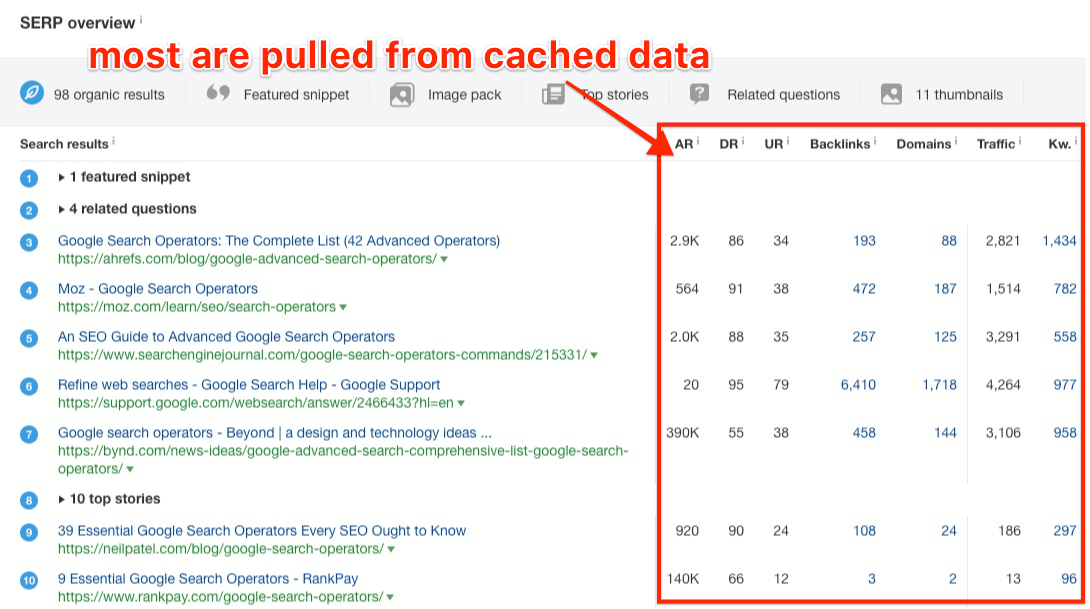
However, we do try to update our cached data frequently so that the discrepancy with “live” data isn’t too dramatic.
Back to You
So these are our keyword reports/research metrics that we get asked about the most.
I hope that this article helps you better understand our SEO tools and data, and helps you distill actionable insights from them.
If you have any other questions about the metrics you see in, comment below, and we’ll be happy to help you.