
In the age of information, the ability to provide information in a quick and easily digestible way is critical to the performance of one’s product or service. Infographics provide a way to engage with an audience quickly and efficiently. Their ease of accessibility allows an audience to look at data-at-a-glance that has been carefully crafted to create a coherent story.
Infographics are commonplace these days, often found in presentations, grocery bags, and anywhere online when one is searching for information.
We’ve provided you with a few easy steps to show you how to create infographics from scratch for your own business.
Contents
Collect your data
First off, know what your infographic will be about and collect the necessary data. Write down the reason that you’re creating this infographic and list the points that you would like to make. Then, collect as much data as you need.

Check your sources for bias
Be sure that the data you collect is from a reliable source. When checking your sources, keep in mind that not everyone wants to spread truth. Check the credibility of any sources that you may be relying on in your infographic so that you don’t end up spreading false information and losing your own credibility.
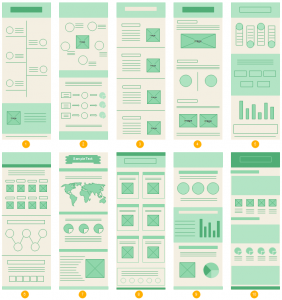
Examples of Wireframes
Create a “wireframe”
A wireframe is basically a skeleton of how your infographic will look. This is the time to map out how you want your data to be read. The wireframe makes it easier to cut and paste your data and graphics into a logical sequence.
Avoid information overload
Infographics should make it easier for your audience to absorb information, not bombard them with too much at once. Try to keep your text short and to the point.
Consider, also, your audience. Your target audience will influence the language and details you use when creating an infographic.
Get creative with formatting
Now that you know what information you want to use and the general layout of your infographic, you can focus on the formatting. This includes engaging graphic design and data representation. Get creative! Remember that what distinguishes an infographic from a list of data is a unique and interesting presentation.
Creativity not your style? No problem. There’s a ton of free infographic templates out there that you can use if you are overwhelmed and wondering how to create infographics that are clear and concise.
Set an appropriate tone
Begin to set the tone of your infographic with the language you use. Do you want your piece to be serious and informative? Or is your audience meant to have fun while reading? The language you use is as important as any other visual element when setting the tone.
Don’t discount typography
The type should be kept in consideration while setting the tone. While you shouldn’t rely heavily on the typography to add pizzazz to your infographic, you also can’t get away with just any old font. Typography should be used alongside the data and images when providing information to your audience.
Be smart with color
Color will grab the attention of your reader, but don’t get carried away. The best infographics tend to stick with a color scheme of 3 main colors. But don’t overwhelm your audience with an overabundance of colors.
Colors should also portray the mood that you’re trying to convey. Figure 1 shows the emotions and moods that colors are supposed to convey.
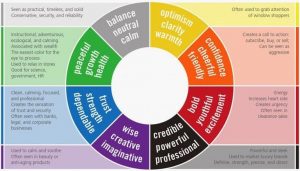
Figure 1
Leverage your whitespace
Also called blank space or negative space, whitespace is the area on your infographic with no data, text, or graphic. It’s critical for a good infographic to have a fair amount of blank space so as not to overwhelm audiences with information.
Blank space also keeps the infographic looking clean and helps separate any information.
Finally, proof your final draft
Congratulations! You’re nearly done learning how to make infographics!
Here are just a few more suggestions for your finishing touches:
Proofread
- Make sure there are no spelling errors (especially on proper nouns).
- Double-check your sources.
- Are you fully satisfied with the layout?
Conduct a user-test
- Have your friends or colleagues look over your infographic to make sure other people can understand it. Sometimes, creators become so familiar with their work that some things that make sense to them doesn’t make sense to others.
Step away and take a break
- As I said before, sometimes creators get so caught up in their work that they miss critical errors. Give yourself a break before jumping back into your work.
Revise, Revise, Revise
- Take your friends’ and colleagues’ suggestions and make any changes as you see fit.
There you go! With this list, you have the building blocks for how to create infographics from scratch for your business. Looking to post your new infographic on social media? Check out this article to learn the best times to post.